
My language, ranked simplest on Earth
According to a paper published in a Nature Portfolio journal last week, my language is the least complex sign language in the world. American Sign Language sits at the very bottom of the paper’s Global Sign Language Complexity Index, tied with French Sign Language at 0.466, below Nigerian, Ethiopian, Thai, Burmese and Saudi sign languages. The ranking has a chart and a name and a number to three decimal places.
I went to the Atlanta Area School for the Deaf as a child, and I have spent the years since watching hearing institutions decide what my language is, what it needs and how hard it is. So I read the ranking the way any Deaf person would, which is to ask what it measured. The answer, it turns out, is four facts per language: which family it belongs to, whether its fingerspelling uses one hand or two, how many people use it, and whether a government has recognized it. ASL is “simple” because it is in the French family, fingerspells with one hand, has a large community and has legal recognition. Nothing about its grammar, its use of space, its non-manual markers, or the faces and bodies that carry it entered the calculation.
That would be a curiosity if the paper stopped at a ranking. It does not. “A global taxonomy and computational characterization of major sign languages for scalable AI recognition systems,” by M. Neela Harish, B. Rashmi and M. Srilakshmi of the Department of Biomedical Engineering at Easwari Engineering College in Chennai, appeared in Scientific Reports on October 26 as an Article in Press [1]. It proposes a recognition architecture, a complexity index, and a Fairness Index for sign language AI, and its abstract reports “a maximum accuracy of 91% using the common features of various language families.” A science news site picked it up the next day under the headline “Global Map of Sign Languages Aims to Fix Regional Bias in AI Recognition” [2].
I read all sixteen pages. This piece walks through what is in them, using nothing but the paper’s own equations and tables, because the problems do not require any outside expertise to see. They require a calculator.
What the paper says it did
The paper sets out four contributions: a taxonomy of twenty sign languages, a complexity index, a “highly scalable” hierarchical transformer architecture, and a Fairness Index “to maximize AI performance equity for varied signing communities.” The taxonomy sorts each language by linguistic lineage, fingerspelling hands, a three-tier population band and legal recognition. The architecture is described in three stages: a “language-blind” hand-pose encoder, a family-specific adaptation layer, and a classifier head that maps movements to the glosses of a target language.
The problem the paper names is real. Sign language recognition research has concentrated on a handful of languages with large public datasets, most of all ASL, German Sign Language and Chinese Sign Language, and systems trained on them do not carry over to the hundreds of sign languages that have little or no data. A serious attempt to characterize which languages are underserved, and why, would be useful to researchers and to the institutions that buy these systems. That is part of why the way this paper arrives at its numbers matters.
Where the 91 percent comes from
The 91 percent in the abstract reads like a test result. It is not one. Section by section, the paper builds it out of a formula.
The formula is Equation 1, written out in Table 3: predicted accuracy equals a fixed baseline, multiplied by one plus a set of coefficients. The baseline is 65 percent, which the paper calls “an empirical estimate derived from current sign language recognition benchmarks (e.g., WLASL datasets).” The coefficients come from Table 5, which awards points for each attribute in the taxonomy. A family-aligned lineage earns one point. Two-handed fingerspelling earns two points and one-handed earns one. The largest population tier earns three points. Full legal recognition earns two. Each point is worth 0.05, so the most a language can collect is 0.40, and 65 multiplied by 1.40 is 91.
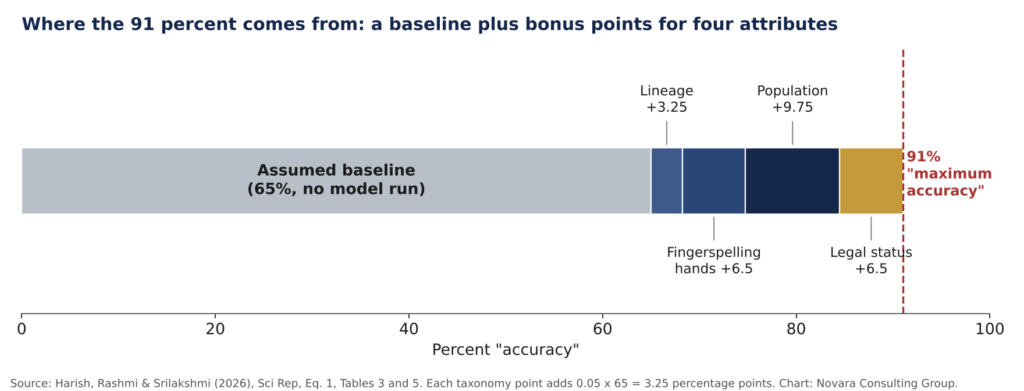
The paper does disclose this, once, near the end of its results. Its accuracy across twenty languages, it says, was “computed ‘theoretically’ through the utilization of a Success Probability Multiplier,” and the values in its main comparison table “are not derived from direct experimental evaluation on a unified multilingual benchmark. Instead, they represent theoretical simulation outcomes based on taxonomy-guided weighting assumptions.” The results “should therefore be interpreted as analytical projections rather than empirical benchmark measurements.”
That sentence is on page ten. The abstract, which is what most readers and every search engine see, says “Analysis of the proposed optimized framework indicates a maximum accuracy of 91%” and calls the result a “preferable mode of communication.” The news write-up repeated the 91 percent. Nowhere in the abstract does the word simulation appear.
There is a second issue inside the first. The paper’s own explanation of who reaches the 91 percent ceiling says it is “achieved by languages characterized by a Tier-1 population, full legal recognition, and a family-aligned 1-handed manual modality.” Add those points up using Table 5 and you get seven, not eight, and 65 multiplied by 1.35 is 87.75. Under the paper’s rules, the only route to 91 is a two-handed, family-aligned language in the largest population tier with full recognition.
The formula does not produce the table
If the accuracy table is a simulation, it should at least be the simulation the paper describes. I took the attributes the paper assigns to each language in Table 2, applied the point values from Table 5, and ran them through Equation 1. For 18 of the 20 languages, the result does not match what the paper reports in Table 6.
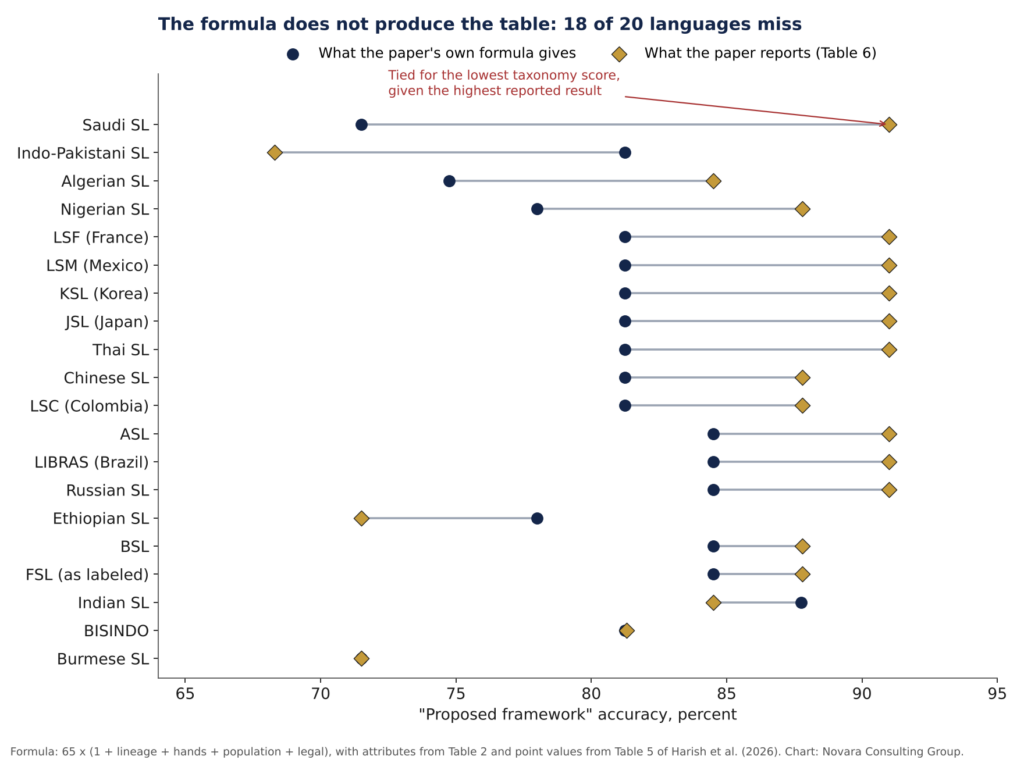
Some of the gaps are small. Some are not. Saudi Sign Language is listed in Table 2 as an independent lineage, one-handed, in the smallest population tier, and with legal status under review. Under Table 5 that is the lowest combination of attributes any language in the paper receives, tied with Burmese, and it should produce 71.5 percent. Table 6 reports 91.00, the ceiling. Indo-Pakistani Sign Language goes the other way: its attributes produce 81.25, and the table reports 68.3. ASL, LIBRAS, Russian, Korean, Japanese, Thai, French and Mexican sign languages are all reported at 91, and none of them has the attribute combination the paper says is required to get there.
I want to be careful about what this shows. It does not show where the numbers in Table 6 came from. It shows that they did not come from the method the paper describes, applied to the inputs the paper prints. A reader trying to check the work cannot get from one to the other.
A Fairness Index that is a division problem
The Fairness Index is the part of this paper most likely to travel, because “fairness” is the word buyers, regulators and grant officers are looking for. Here is how it is computed, from Equation 3:
Fairness Index equals the accuracy of a language divided by the maximum accuracy.
The maximum accuracy is the 91 percent ceiling. The accuracy of each language is its simulated value from Table 6. So Table 7, the Fairness Index table, is Table 6 divided by 91. I checked all twenty values and they match to the rounding. Saudi Sign Language has a “perfect” fairness score of 1.00 because its simulated accuracy was entered as 91.
The introduction promises “a Fairness Index based on standard deviation.” There is no standard deviation anywhere in the computation. The interpretation offered is that “as the FI increases, it means that the system is more equal as it approaches the mean and becomes less volatile.” The index does not involve a mean, and there is no system whose volatility could be observed, because no system was run.
What the Fairness Index contains, in full, is a ratio between two numbers produced by a points table about lineage, fingerspelling, population and law. It contains nothing about any Deaf person, any dataset, any signer’s skin tone or lighting or regional variety, any error, any deployment, or any outcome. The paper’s own limitation, buried in the results, is the honest description: an analytical projection. The name on the table is “Fairness Index.”
The validation step checks the formula against itself
The paper then sets out to show that its two indexes mean something, by correlating the complexity index against the Fairness Index across twenty languages. It reports a Pearson correlation of minus 0.497 with a p-value of 0.026 and concludes that this “proves there is a significant relationship between linguistic complexity and model fairness.”
Consider what is being correlated. The complexity index is a weighted sum of four inputs: lineage, fingerspelling hands, population and legal status. The Fairness Index is a rescaled function of the same four inputs. Two quantities built from the same ingredients will tend to move together, or against each other, because of how they were built. Finding that they do is not a discovery about sign languages or about AI. It is a description of the spreadsheet.
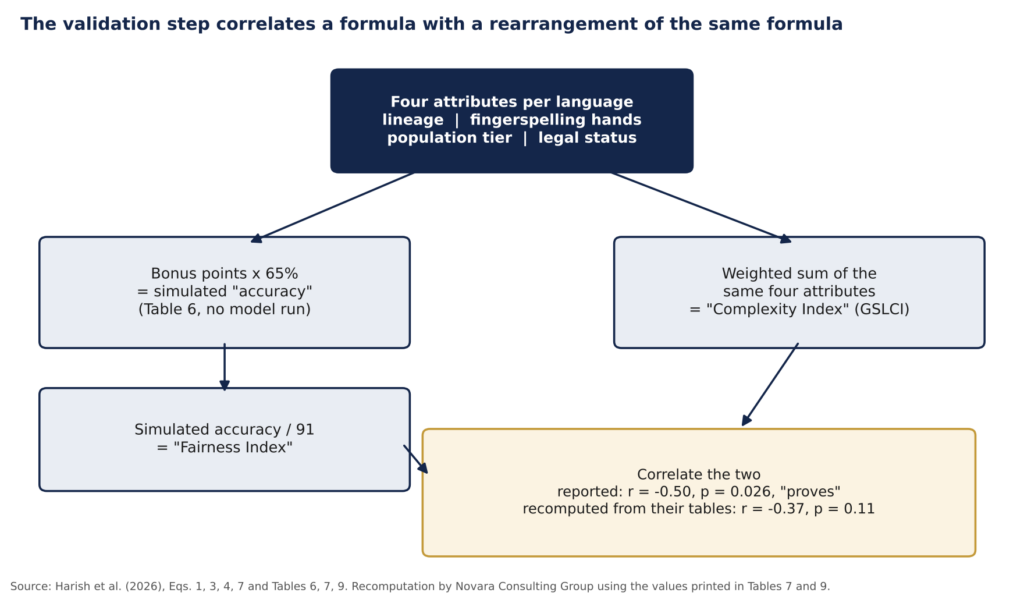
It also does not reproduce. Using the twenty Fairness Index values printed in Table 7 and the twenty complexity values printed in Table 9, the Pearson correlation is minus 0.37 with a p-value of 0.11, which is not significant at the threshold the paper itself uses. The scatter plot the paper presents as Figure 7 shows Fairness Index values as low as 0.60. The lowest value in Table 7 is 0.75. The figure was not drawn from the table.
The complexity index has its own trouble. The paper gives it three definitions. Equation 4 is a weighted sum of the four taxonomy attributes. Equation 5 is the average of precision, recall and F1 score across gesture classes, which is a performance measure, not a complexity measure, and reuses the letter P for precision after using it for population. Equation 6 sets the weights at 0.20, 0.10, 0.20 and 0.20, which add up to 0.70 rather than one. Running Table 9’s own inputs through Equation 6 gives ASL a score of 0.316, not the 0.466 the table reports. And Table 9’s inputs depart from the scoring key in Table 8 for 16 of the 20 languages: two-handed languages scored as one-handed, one-handed as two-handed, population tiers reversed, and legal status scored for a different status than the one Table 2 lists.
The one experiment, and its matrix
There is a real experiment in the paper, and it deserves a fair reading. Table 4 reports results on five public datasets: WLASL for ASL at 83.1 percent, AUTSL for Turkish Sign Language at 72.4, CSL-Daily for Chinese Sign Language at 79.6, INCLUDE for Indian Sign Language at 68.7, and ArSL2018 for Arabic Sign Language at 70.3. These are the only numbers in the paper that appear to come from running a model on signing.
The model they come from is described as “the proposed multilingual CNN framework.” The paper’s proposal is a hierarchical transformer. No layer configuration, training procedure, data split, preprocessing step or code is given for the CNN, and the transformer is described only as three conceptual stages. A reader cannot tell which model produced Table 4, how it was trained, or whether it was one model across five datasets or five models.
The paper does print one confusion matrix, for the Indian Sign Language result: 687 true positives, 308 false positives, 320 false negatives and 2,685 true negatives. Those figures give a precision of 0.69 and a recall of 0.68, which match the table. They give an accuracy of 84.3 percent. The paper reports 68.7. A single two-by-two matrix is also an odd thing to report for a dataset of many sign classes, and the paper does not explain how it was derived.
The data availability statement reads: “The data used to support the findings of this study are included within the article.” The article contains no data beyond the tables discussed here.
Who was in the room
None of this would matter as much if the paper’s framing were careful about the people it describes. It is not. The research was funded by India’s Department of Health Research, under a start-up grant for “Establishment of an International Sign language laboratory,” and the paper describes its beneficiaries as “people with hearing and speech impairments.” It expands DHH, a term Deaf and hard of hearing people use for themselves, as “speech and hard-of-hearing,” and its conclusion speaks of “the speech and hard of hearing community.” For an account of how sign languages spread across Africa, it cites an 1881 study by Garrick Mallery whose title ends “and Deaf-Mutes.”
The paper’s first figure illustrates the sign SORRY in eight sign languages. In the panel for German Sign Language, the word is fingerspelled letter by letter, S-O-R-R-Y. That is the English word, spelled out, standing in for a German Sign Language sign.
The reference list has its own pattern. The paper’s 65 percent baseline cites a review of light field occlusion removal in imaging. Its Success Probability Multiplier cites a study of time multipliers in the survivability of information systems. Its statement that a p-value below 0.05 is statistically significant cites “Cutting a Path: The Power of Purpose, Discipline, and Determination,” a 2023 book from BrownBooks. The list also includes a study of vignetting in dermatological images.
The paper describes no Deaf co-authors, no Deaf signers, no consultation with any Deaf organization, and no review of its taxonomy by anyone who uses the languages it ranks. That is not a technicality. A fairness metric for sign language AI is a claim about whether a system serves Deaf people equitably. A fairness metric built without them, computed without any of their signing, and named in a medical register they rejected decades ago, is not a fairness metric. It is a label.
Why this matters to a buyer
Scientific Reports is a peer-reviewed, open-access journal in the Nature Portfolio. This paper carries a permanent DOI. It is citable today, and it will be citable forever, whatever the final edited version looks like. The phrase “Fairness Index for sign language recognition” now has a reference attached to it.
I have read a lot of sign language AI vendor material this year. Much of it has a page near the back called something like Responsible AI or Equity, and that page cites research. It is easy to picture the sentence: a 2026 study in Scientific Reports introduced a Fairness Index for sign language recognition across twenty languages and reported accuracy of up to 91 percent. Every word of that sentence would be technically true. None of it would tell a transit authority, a hospital or a state agency anything about whether the product in front of them understands, or is understood by, the Deaf people who will depend on it.
This is the gap NCG’s SLAT Index was built to close. Its evaluation standard treats a published claim as a claim, not as evidence, and the program’s position on output validation is that Deaf people fluent in the language being produced are definitional to judging whether it is right, not an optional extra. The paper is a clean example of why that line exists. It shows how a number can pass peer review, earn a DOI and a headline, and still contain no observation of a single signer.
When a vendor, a consultant or a grant application cites a fairness metric for sign language AI, three questions will usually settle it. First, what was measured, and on whose signing? A fairness claim needs real output from real systems on real people, and it needs to say which people. Second, can the number be rebuilt from the paper? If the equations and the tables do not agree, the number is not yet evidence of anything. Third, were Deaf people, fluent in the languages being ranked, part of designing and checking the measure? If the answer is no, the metric was built about a community, not with it, and it should be weighed that way.
What should happen next
This is an Article in Press, which means the journal has said the text is subject to further edits before the final Version of Record. That is an opening. The abstract should say plainly that the 91 percent and the twenty-language comparison are simulated. The tables should be reconciled with the equations, or the equations with the tables. The correlation should be recomputed from the values the paper prints. The Fairness Index should either be renamed for what it is or rebuilt on observed performance across signers. And the language describing Deaf people should be the language Deaf people use.
None of that requires bad faith to explain. Most of it looks like a project that ran out of time, data and review before it ran out of ambition, and the problem it set out to address is a real one. But the cost of a paper like this does not fall on its authors. It falls on the Deaf user at the other end of a system that someone bought because a vendor deck said it had been checked for fairness.
If the authors or the journal respond, we will publish their response alongside this piece.
Kaynakça
- Harish, M. N., Rashmi, B., & Srilakshmi, M. (2026). A global taxonomy and computational characterization of major sign languages for scalable AI recognition systems. Scientific Reports. Article in Press, published online October 26, 2026. https://doi.org/10.1038/s41598-026-65810-z
- Bioengineer.org. (2026, October 27). Global map of sign languages aims to fix regional bias in AI recognition. https://bioengineer.org/global-map-of-sign-languages-aims-to-fix-regional-bias-in-ai-recognition/